ehrdata.integrations.vitessce.gen_default_config#
- ehrdata.integrations.vitessce.gen_default_config(edata, zarr_filepath=PosixPath('adata_for_vitessce.zarr'), *, obs_columns=None, obs_embedding=None, scatter_var_cols=None, layer='tem_data', timestep=0, return_lamin_artifact=False)#
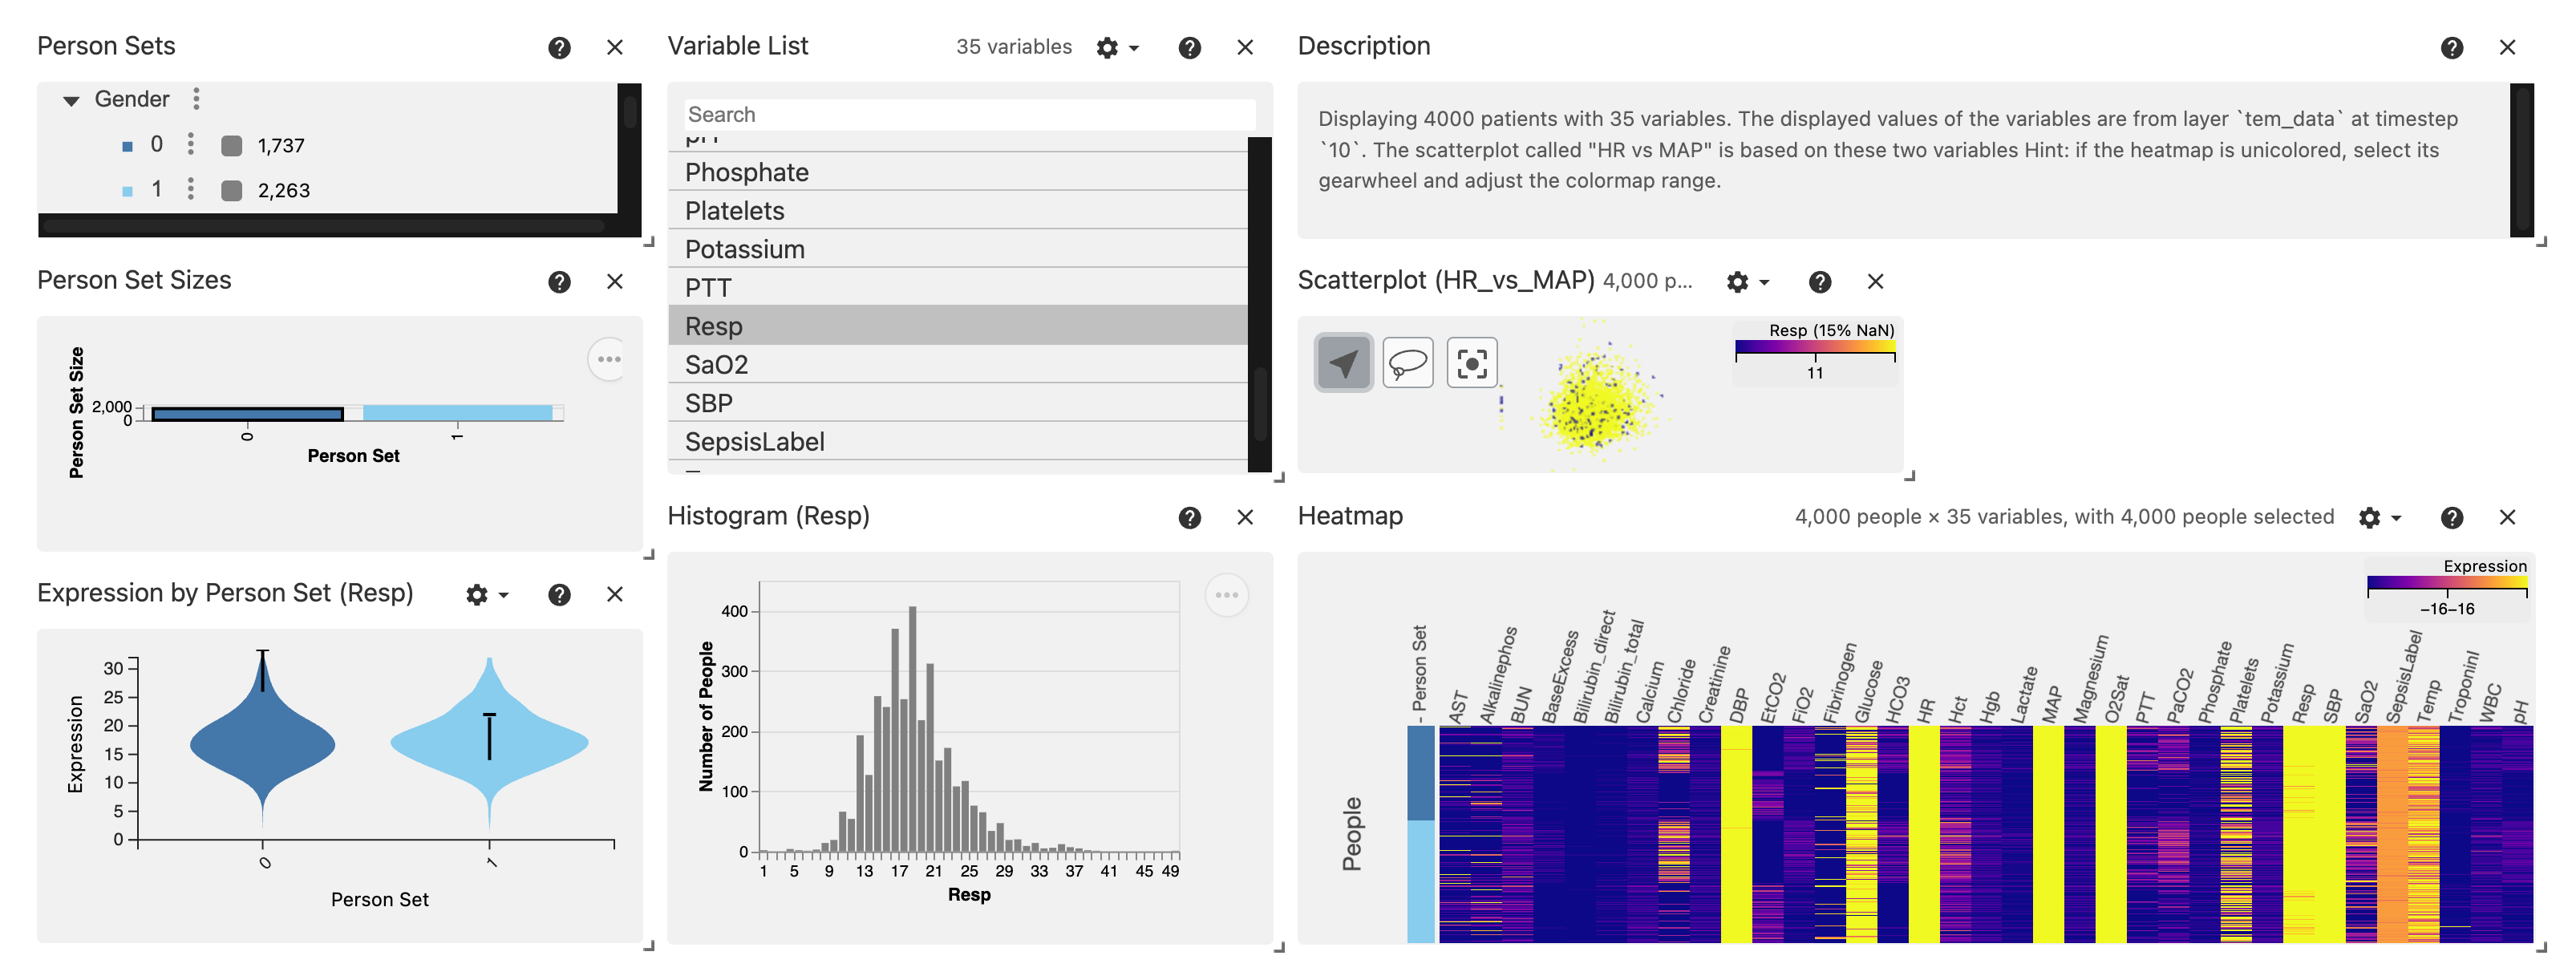
Quickstart interactive Vitessce generator.
Vitessce [KGM+25] is a tool for interactive exploration of high-dimensional data, and compatible with
EHRData.While Vitessce has many features, this function provides a convenient way for an opinionated set of illustrations for an
EHRDatato explore interactively together(called “views”). Specifically, this function will create a Vitessce widget with multiple views:A view with patient groups of selected columns in
edata.obs(obs_columns)A list of variables to display values for (
obs_embedding)A bar plot for the number of categories of groups selected during the interactive exploration
A scatterplot of the selected
obs_embeddingif providedA scatterplot of 2 variables if provided in
scatter_var_colsA violin plot of selected variables across groups selected during the interactive exploration
A histogram for selected variables during exploration
A heatmap of the variables selected in
var_cols
See the vitessce-python documentation for more details and examples.
- Parameters:
- edata
EHRData EHRData object to visualize
- zarr_filepath
Store|StorePath|FSMap|Path|str|dict[str,Buffer] |Path|str(default:PosixPath('adata_for_vitessce.zarr')) Path to save the prepared zarr file that Vitessce can read from.
- obs_columns
Iterable[str] |None(default:None) List of observation column names (without ‘obs/’ prefix)
- obs_labels
Optional dict mapping column names to display labels
- obs_embedding
str|None(default:None) Embedding key in edata.obsm
- obs_embedding_labels
Optional dict mapping embedding keys to display labels
- scatter_var_cols
Iterable[str] |None(default:None) Optional list of 2 variable columns to create ascatterplot from
- layer default:
'tem_data' Name of the layer to use for visualization. If the layer is 3D (temporal), a timestep must be selected. Default is “tem_data”
- timestep default:
0 For 3D layers, the timestep index to extract. Default is 0
- return_lamin_artifact
bool(default:False) If
True, return a LaminArtifactof the generated .zarr file.
- edata
- Returns:
VitessceConfig object
Examples
>>> import ehrdata as ed
>>> edata = ed.dt.physionet2019(
...     layer="tem_data",
...     n_samples=4000,
... )
>>> vc = ed.integrations.vitessce.gen_default_config(
...     edata,
...     obs_columns=["Gender", "Age", "training_Set"],
...     scatter_var_cols=["HR", "MAP"],
...     layer="tem_data",
...     timestep=10,
... )
>>> vc.widget()